Charts
- Origin-share comparison · PNGchina-us-shares-2022.png · 130 KB
- Origin-share comparison · SVGchina-us-shares-2022.svg · 27 KB
- Origin accounting · PNGorigin-accounting-2022.png · 132 KB
- Origin accounting · SVGorigin-accounting-2022.svg · 20 KB
Observation year: 2022 · Study completed:
A 2022 benchmark for Japan, South Korea and Germany across electronics, electrical equipment and machinery, using the full OECD production network.
Read the nine results ↓ · Inspect the method ↓ · Printable study ↓ · Complete study package ↓
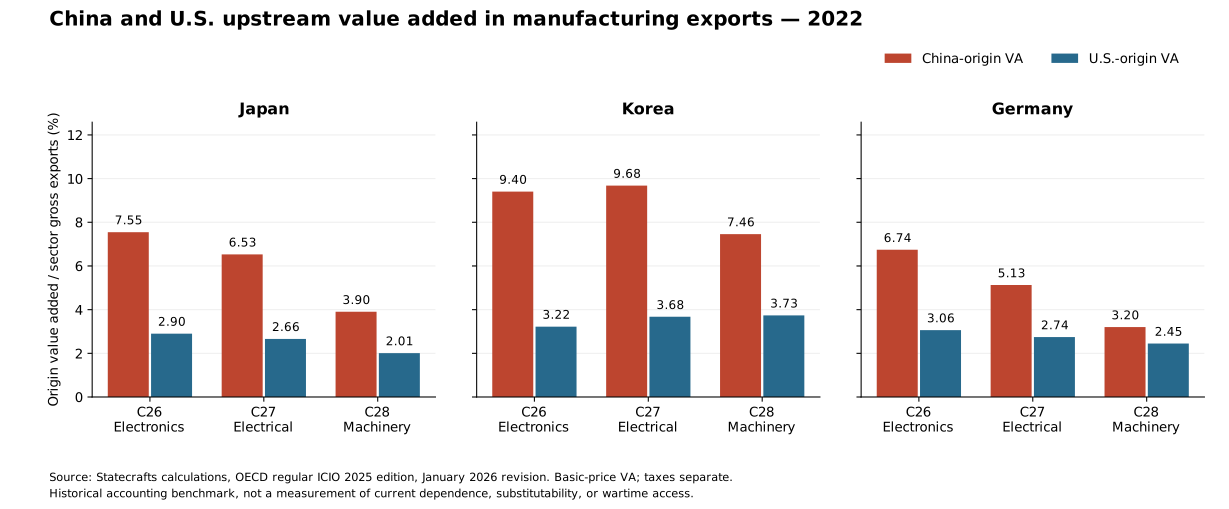
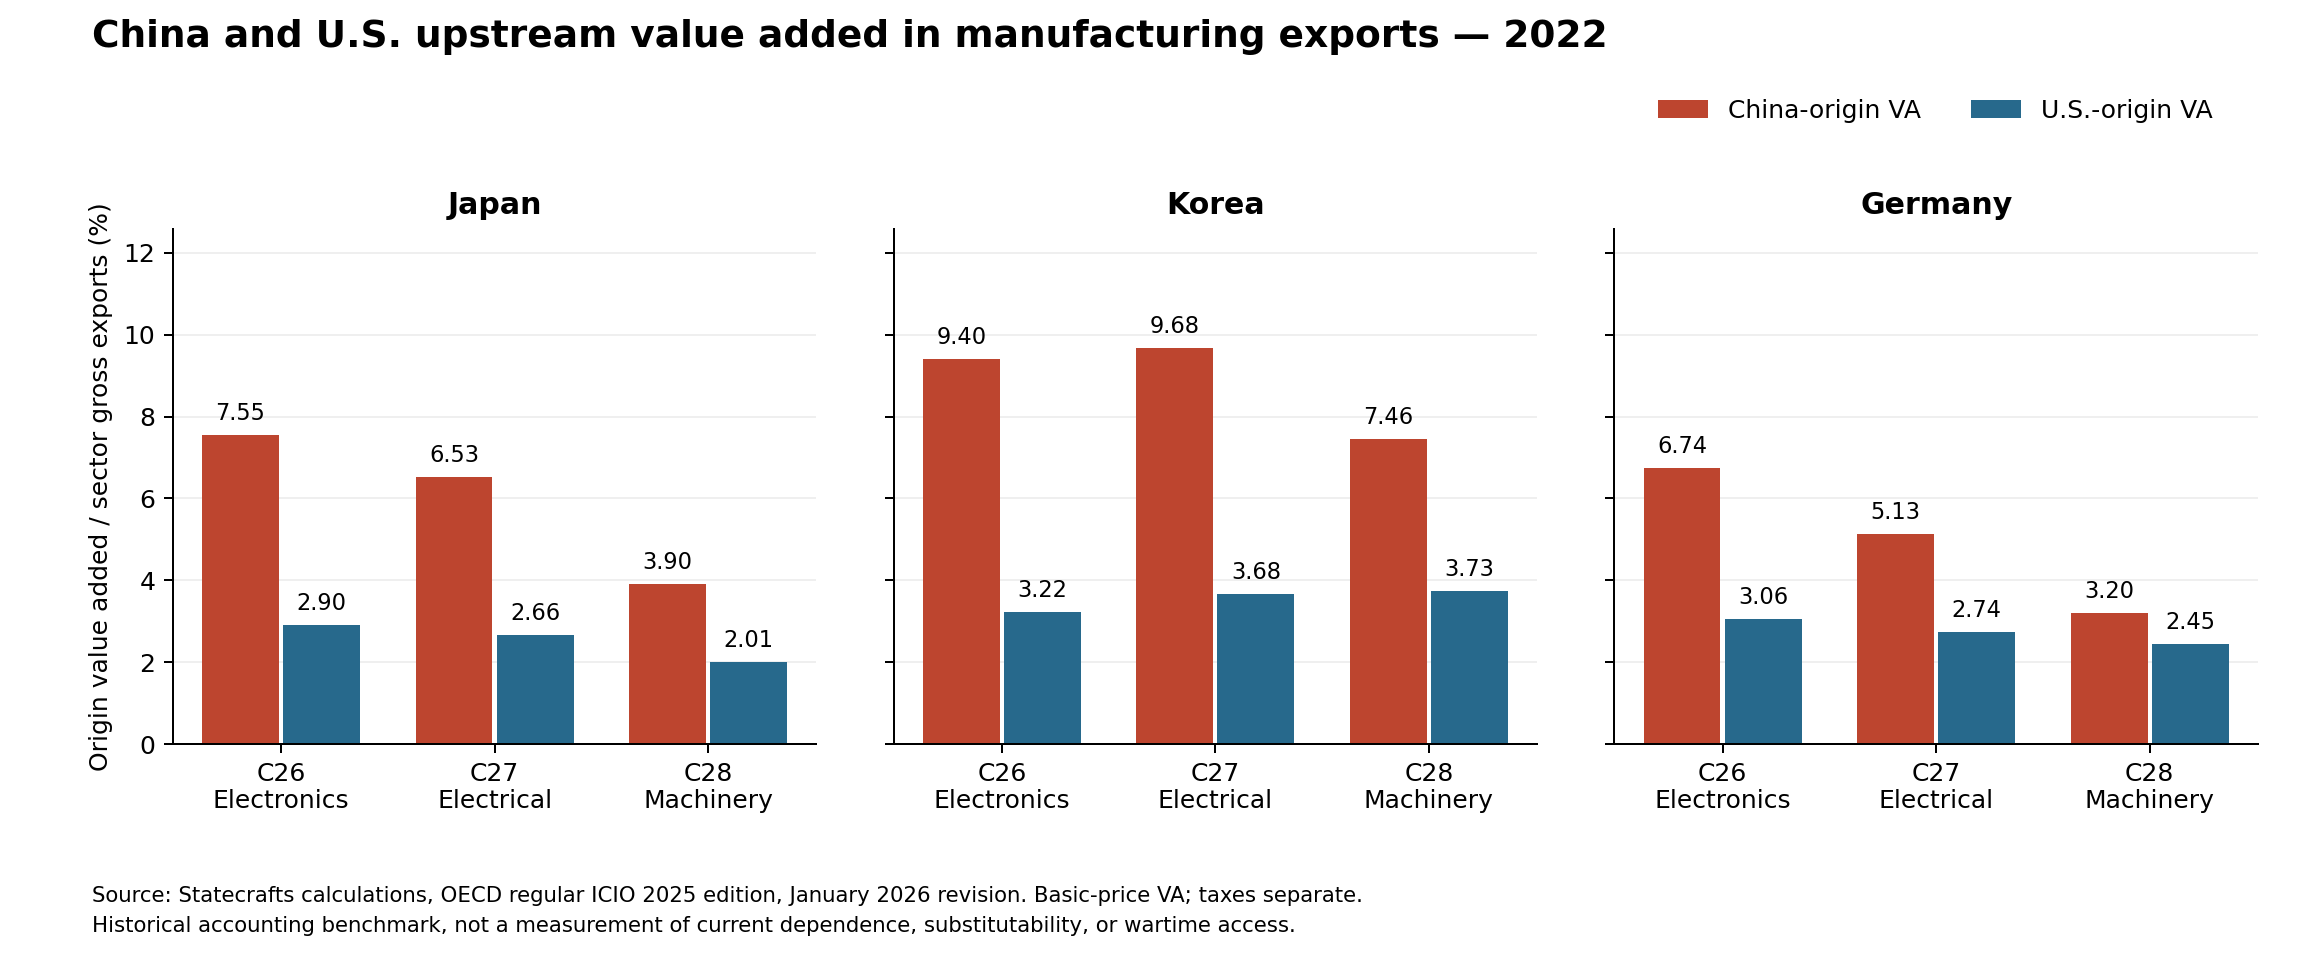
China-origin basic-price value added accounts for 3.20–9.68% of the nine selected gross-export bundles; the corresponding U.S.-origin shares are 2.01–3.73%. These are separate economy–industry results, not an average or a coalition total.
South Korea has the highest China-origin share in each of the three matched industries. Its electrical-equipment exports have the largest share in the sample, 9.68%, compared with 3.68% from the United States. Germany's machinery exports have the smallest China-origin share, 3.20%, compared with 2.45% from the United States.
The implication for U.S. planning is bounded: shifting final sourcing to an ally does not, by itself, establish independence from Chinese upstream production. Use this historical screen to identify where current supplier tracing would be valuable—not to estimate production lost in a disruption.
This is a 2022 accounting benchmark, not a present-day substitutability test. Value-added shares do not measure bottleneck severity, qualified alternatives, inventories, military suitability or wartime access.
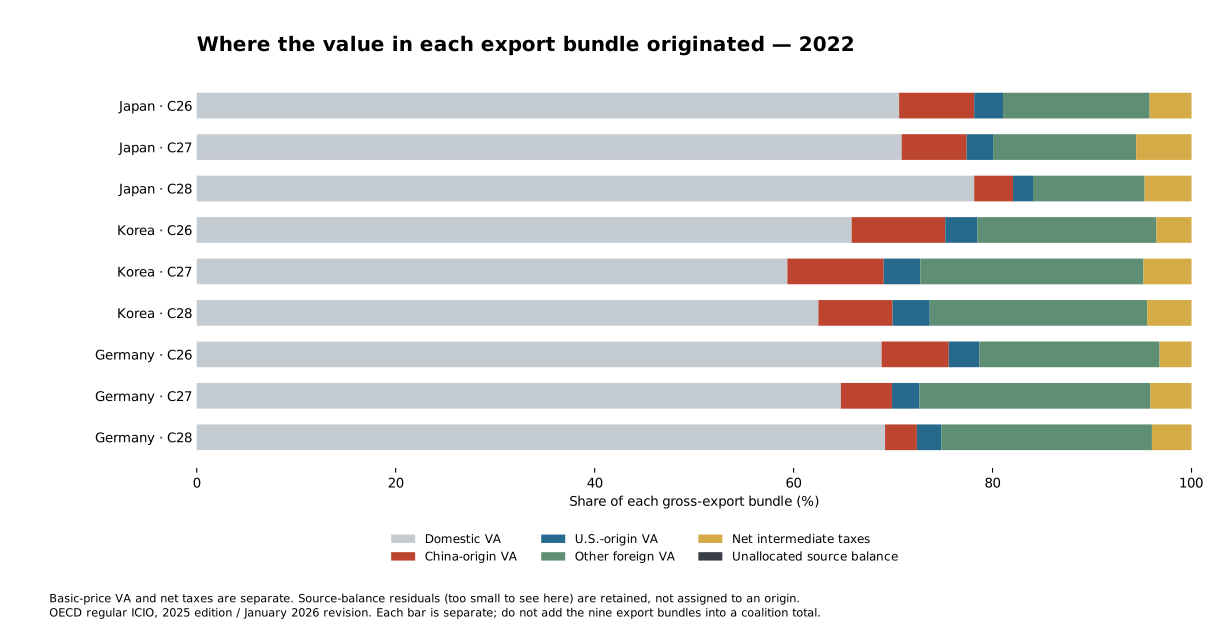
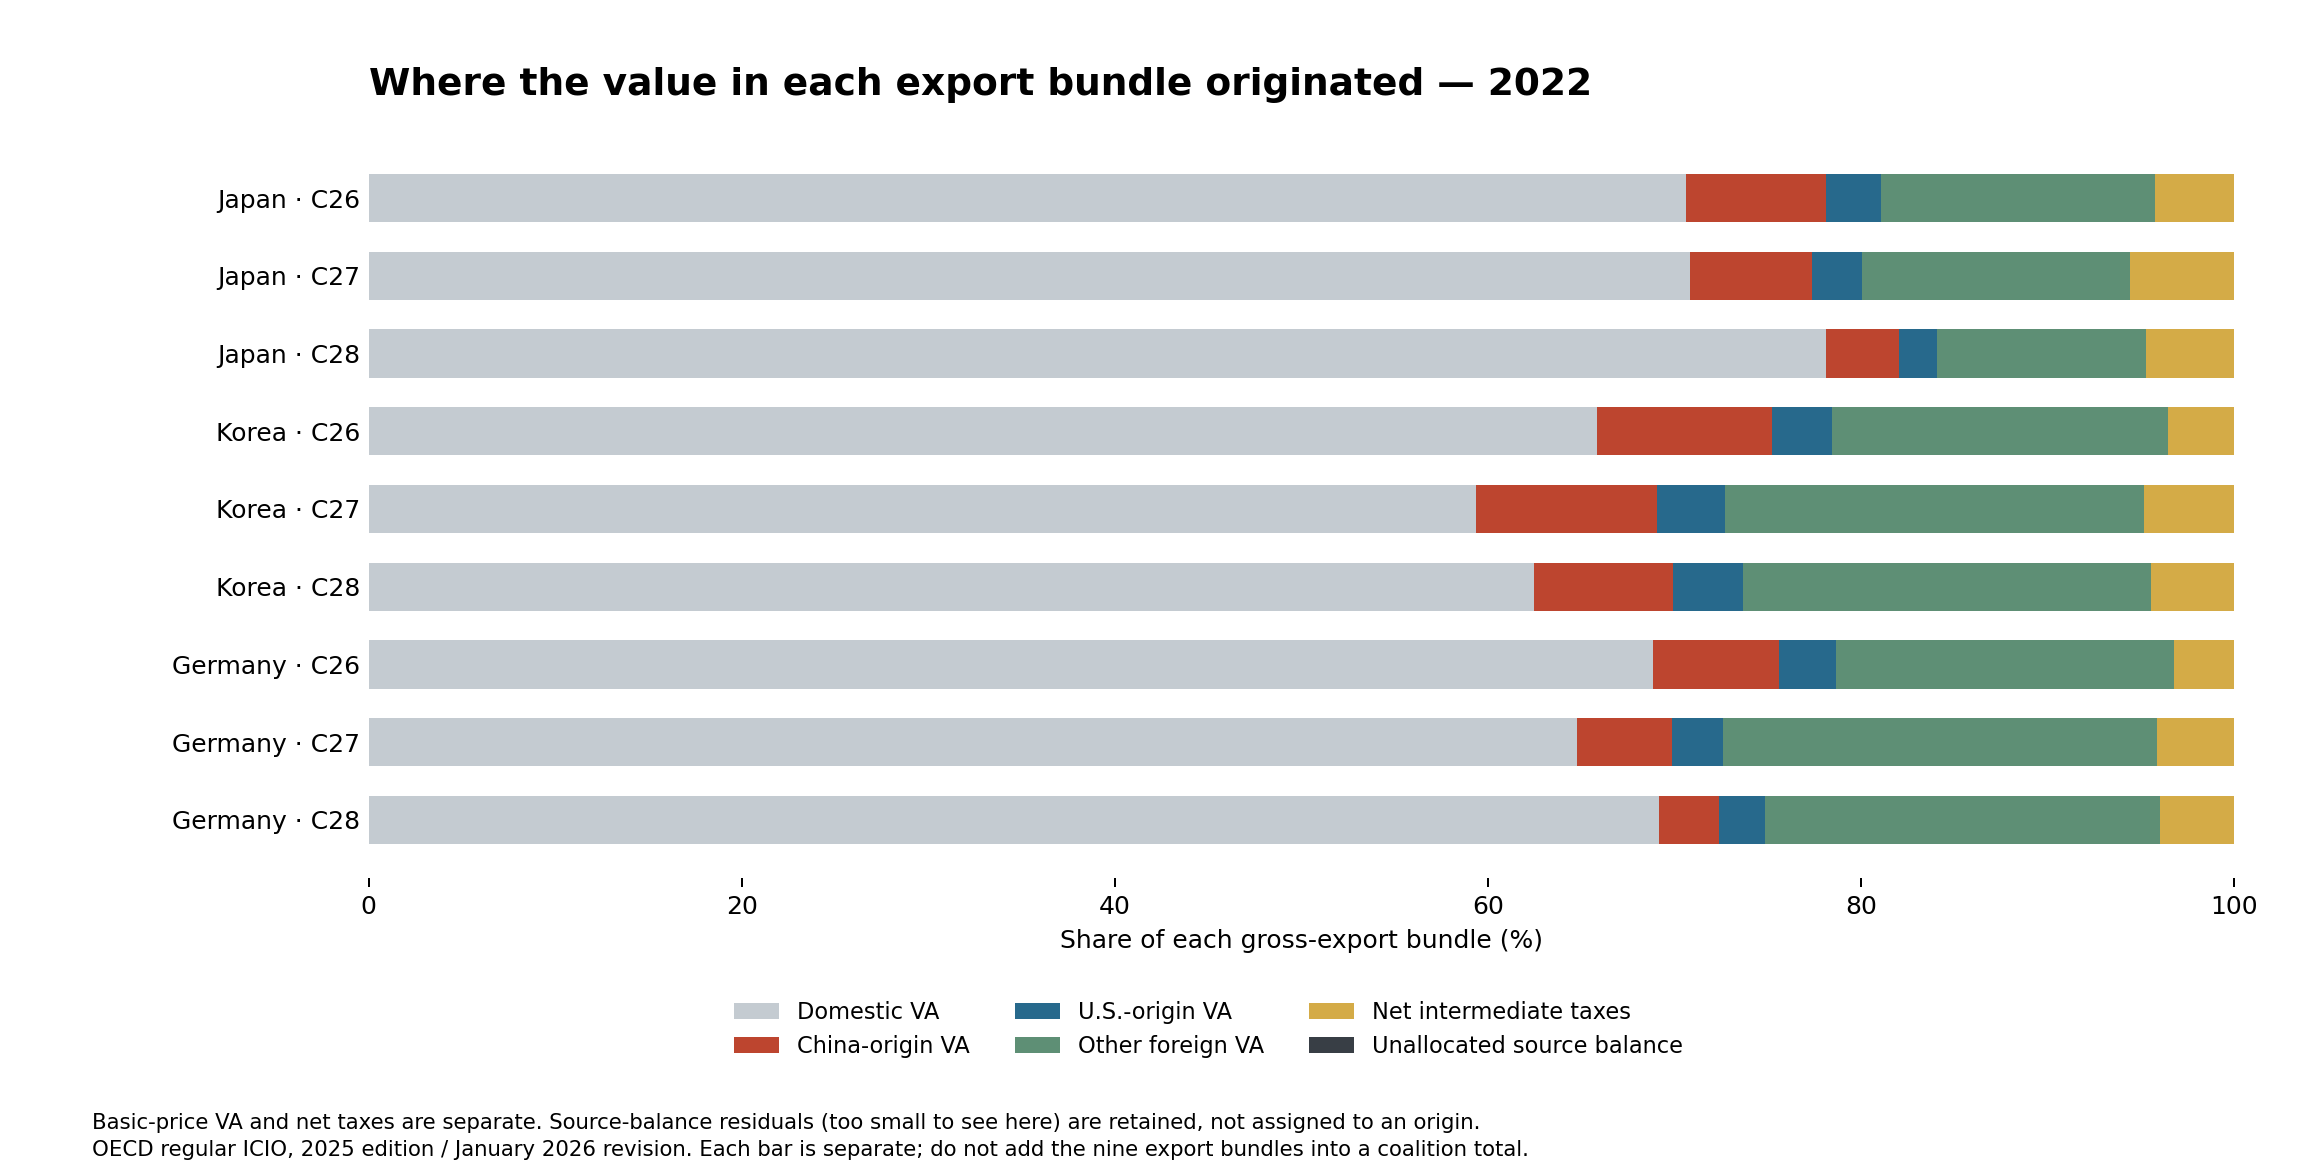
Each denominator is one economy–industry's gross exports to all foreign destinations, including intermediate and final uses. The two shares trace value added through the full global upstream system; they are not direct-import shares. Monetary amounts below are current USD million.
China minus U.S. is a percentage-point difference, not a competitive-advantage score. Values are displayed to two decimal places; the results CSV retains the calculation precision. All nine cells are shown separately; no coalition total is calculated.
| Exporter / industry | Gross exports USD million | China VA USD million | China share | U.S. VA USD million | U.S. share | China − U.S. percentage points |
|---|---|---|---|---|---|---|
| JapanComputers, electronics and optical productsJPN · C26 | 74,727.04 | 5,639.30 | 7.55% | 2,167.77 | 2.90% | +4.65 |
| JapanElectrical equipmentJPN · C27 | 54,486.59 | 3,557.06 | 6.53% | 1,449.21 | 2.66% | +3.87 |
| JapanMachinery and equipment n.e.c.JPN · C28 | 112,598.48 | 4,396.05 | 3.90% | 2,261.84 | 2.01% | +1.90 |
| South KoreaComputers, electronics and optical productsKOR · C26 | 182,925.76 | 17,202.41 | 9.40% | 5,889.51 | 3.22% | +6.18 |
| South KoreaElectrical equipmentKOR · C27 | 31,118.90 | 3,012.31 | 9.68% | 1,143.69 | 3.68% | +6.00 |
| South KoreaMachinery and equipment n.e.c.KOR · C28 | 45,164.88 | 3,368.33 | 7.46% | 1,686.85 | 3.73% | +3.72 |
| GermanyComputers, electronics and optical productsDEU · C26 | 86,343.14 | 5,823.44 | 6.74% | 2,644.04 | 3.06% | +3.68 |
| GermanyElectrical equipmentDEU · C27 | 82,172.40 | 4,215.32 | 5.13% | 2,255.31 | 2.74% | +2.39 |
| GermanyMachinery and equipment n.e.c.DEU · C28 | 162,659.87 | 5,207.71 | 3.20% | 3,981.06 | 2.45% | +0.75 |
Data and definitions: SC26-ICIO · SC26-README · SC26-ANNEX · SC26-TIVA-GUIDE · SC26-WB-ARCHIVE. Domestic, other-foreign, tax and residual amounts are retained in the full results and all-origin reconciliation.
The question is how much basic-price value added originating in China, compared with the United States, is embodied in each selected economy–industry's 2022 exports. Export destinations include the entire foreign market, not only the United States.
Japan, South Korea and Germany were selected before estimates were inspected, alongside C26 (computers, electronics and optical products), C27 (electrical equipment) and C28 (machinery and equipment n.e.c.). This is a purposive manufacturing sample: three partner economies with substantial manufacturing activity, not a representative sample of all allies. The three-industry extension is explicit; the September 19 protocol originally specified electronics.
Every origin industry is retained in the calculation: 80 economies plus the rest of the world, with 50 industries each. The Chinese contribution can therefore reach an exporter indirectly through third countries and need not appear as a direct import from China.
Evidence: SC26-ICIO · SC26-ANNEX · SC26-TIVA-GUIDE.
For a U.S. buyer or program selecting allied supply, use origin exposure as an initial tracing question. In this sample, South Korean electrical equipment and electronics are the first places to investigate if the screening criterion is China-origin value-added share. That is not a ranking of military importance, expected disruption loss or preferred suppliers.
Before crediting a particular allied source as independent redundancy, identify its relevant upstream plants and parts, map Chinese-origin inputs through intermediary suppliers, and verify qualified alternatives, inventories and switching times. Access permissions, contract capacity and delivery schedules must also match the U.S. requirement.
Support a substitution or capacity intervention only after those product-level checks establish the binding constraint. This study estimates neither the cost of replacing an input nor the return to a subsidy, tariff or stockpile; it does not justify blanket exclusion of any partner or industry.
China's larger share than the United States is an accounting comparison, not a national-power score. Other partner-origin inputs and the exporter's own value added remain substantial. The source-based comparison must not be interpreted as a choice between only Chinese and American suppliers.
Evidence: SC26-ICIO · SC26-TIVA-GUIDE.
A value-added share records the economic value attributable to an origin, not an input's indispensability. A cheap component can halt an expensive production line, while a larger commodity input can have readily qualified alternatives. Thus the country–industry with the smaller Chinese share is not necessarily more resilient.
Different industry mixes, prices and input intensities can explain cross-country differences within these broad categories. The regular tables also average across firms rather than identifying the supplier network of any particular plant. They cannot isolate semiconductors, batteries, machine tools or defense-qualified products from their larger industries.
This is one observation year, not evidence that dependence has risen, fallen or persisted unchanged through 2026. A present-day decision requires updated supplier evidence; a historical trend requires comparable calculations for additional years.
Evidence: SC26-ANNEX · SC26-ICIO · SC26-TIVA-GUIDE.
The numerical source is OECD's 2022 regular ICIO table from its 2025 edition, January 2026 revision, as identified in World Bank replication catalogue 511. The matrix was retrieved from that institutional archive when the direct OECD bulk-download route was unavailable. Its SHA-256 matches the archive's March 20, 2026 data-hash report. Byte identity with the currently hosted OECD ZIP was not established.
The primary numerator follows the original study protocol: the table's VA row at basic prices. Net taxes less subsidies on intermediate products are carried separately as TLS. OECD's published TiVA decomposition includes these taxes within its value-added convention, and uses the extended rather than regular matrix. Our primary shares are therefore not interchangeable with published TiVA indicators.
The downloadable results include a separately labelled VA-plus-TLS sensitivity. Source-account imbalances are retained as an explicit unallocated balance contribution, not silently normalized away or reassigned to China or the United States.
Evidence: SC26-WB-ARCHIVE · SC26-README · SC26-TIVA-GUIDE.
For each of the nine cells, trace one gross-export bundle through the full global intermediate-input system. All monetary amounts are current 2022 U.S. dollars expressed in millions; percentages use that cell's gross-export value as the denominator.
Source definitions: SC26-ICIO · SC26-README · SC26-ANNEX · SC26-TIVA-GUIDE · SC26-WB-ARCHIVE.
The September 19 protocol remains a historical, then-unexecuted specification. This completed study is a later, separately dated result; it does not rewrite that record or revise any existing comparative rating.
The 4,050-industry source matrix has 123 output-row and 26 input-column discrepancies larger than conservative four-decimal rounding allowances. The largest absolute discrepancies are USD 238.6058 million in the U.S. real-estate output row and USD 82.0320 million in the Chinese real-estate input column. These source inconsistencies are disclosed, not repaired or described as rounding.
For the nine selected export bundles, the propagated signed input-balance contributions are USD 0.00787–0.04458 million. The maximum relative contribution is 0.00003372% of a bundle; propagating absolute rather than signed input gaps reaches 0.00004788%. These are accounting diagnostics, not bounds on model or measurement uncertainty. No gap is assigned to an origin's value added.
The forward numerical solves have a maximum residual of 1.17 × 10⁻¹⁵ relative to their export input. Once the explicit VA, TLS and unallocated source-balance accounts are included, the remaining reconciliation error is at most 5.08 × 10⁻¹⁶ of exports. The primary validation status is 'passed with source-balance warnings', not a claim of perfectly balanced source data.
An independent implementation reconstructs the raw CSV and uses transposed origin-specific systems, checking all nine cells and every one of the 729 cell–origin contributions. It is an independent computational check by a second AI agent, not external human peer review.
Numerical validation → · Independent check → · Review receipt → · Every origin's contribution →
Study JSON: narrative, results, sources and download checksums →
c4d10865f975c1392faa96c11e0da9ab22fc29024540c0cbbeb32a0fed6a6fb48a292179a1c3a15eaa5eaa191c466f08aa7ac407347cc471fdd5ac7f35f96a22e13ed8c99d1fffe661e775d6b6ef4fcbe9d0edfd7291f5b10c1de7c967c471db4e83b7e9be407681546d2ae3cfbc2fdf7a0bae61b718544246c003e9179b8ddf902d61ac828e86f4b45a7ab7b330eff8d9345900f820ef5f808868cca25053ec59baf8f072cb1305b4d51c0dbe8bf4aa33df8a359a0aaa484df7a4f04e6629f3eed8f9d26d9a532e062850863208671c3c57fe9adc32611be82baa40e6f9504e4b81b6b6a549771115529e6900b9589835cdbfff0c6acf179aef53d283b744d5e7d165563ff9056ff9cf90732f815c5feb3af523aa968dcbde13913a487dcd4fdac03b57825f62200175544296ad4805cf208ca4b9065c15b97584edfbfa294f1b6b11375ca42e76141f770b8bd2f8d0e515af394d3aee67c39259bff6dd1e8a08a84a2a3d9b5a4466f61cfd1023b2a005eeb990e26cfb3f6de85c9aa7a6a21d835cb59c365cdfc7b51c26d10951152c6ba1fde2b1564bb0474218f5d73a3d4f5ee8416035146e2d0b9ff363e5df9bb241f017999a6dafd590ab94b5fa66a510e562f47ddf4465d72cf58348dbe15f530419ec8fe34178f1e7993a670c25c8230286efc4a89dd124dfa3a3a444391b38bb56aedb5e3fd9fe0ec6d5cabe8be2940da26a486585143d3b65dbc9fda5f303c8186d01f35fbb5182d567c7eda33f250839b92af506fd94d9d818e80698fe85899b3cefbb4ad35149713c21cf54b1994ceccbe5516424dae98a8bc8252fa281855f9cbca51578945dc4f0a028a21a7565e5b4a29070ac00c5a4342feeafdabaca9ba0cad8593d99000620260b326ed9b76deca0b120653c71fbe667f9b349ae7086ff2f72d4239b81ea310f05322845babbd2f83a628929174ab69733dbd1783095d9aa7344369807f596887c14ca8a5aa5081567a159eab5d5f02668f9d24793c42f5c1f6ae8443ea59e3bf39039e1d1e8fc69aaca9c6bd4ce09e245aeaea07acf39a10613832cf6881af591ccfbb178a584c1ac4d3bf1d29d89b257507b0c940352bec0fd90d62fd8be2ce329edcde9873baeef3c421f75e74edbca4e1c6806af0cec3d572310aea0f7539217e4d99f09e89ac8d7532135c824c1e11b23ab321373db2164a3613dd97b502cb052e942318db5e0ab68c52ffe3e02926f6b52dc4f41d7c33f5d7205a18adae59b8dc81c1ce0d2a02751dc0f9376561fd95d4547ad599e297abe6744a38637cc51681ab6e90c4efa22de07b866697656c072bf1646da4bc8db857fd3d210191c62e102c0da3d86e18590c1ee7b1fdec68307564f3ebf6ef6fe2887353e9f023fd84c58c8114cfbdb3d96cd0e5582b98b822c8d7b32e86e1e3027bd0cb570cbe7a68e74da2f3c52cc7963aa8f7265a0a4c0961ed6b9f464085ca0680f61e82a2513d315fe580246f29ebef7e633f85defcad7fa18c592672b24a46bb67169d66f95e547324e330f00841c900dd35e2f459b9074cee9da12e6f33f8059964076c90b686df11fd6eac8f87d4a55b0ffc9db1d15c3a7466dc8c105d72640b9a52571c2734b31ba1775fc34372a30eb37f3f97d5f8e9eaf2cd68a42ccb340b84f5a1151b0feded4a74c9123f70bfe56b2ebeee7091784079d589c73fb2ae1c1e265f96efda8e61b92f1c49f0e94ded4660035573eeaa528613df148069e3c530033730d0a38SC26-ICIO · OECD · 2026-01
Dataset coverage, regular-versus-extended distinction and January 2026 revision.
SC26-README · OECD · 2025
Units, matrix layout, VA and TLS rows, and final-demand categories.
SC26-ANNEX · OECD · 2025
Economy identifiers and definitions of C26, C27 and C28.
SC26-TIVA-GUIDE · OECD · 2025
Full-network gross-export decomposition, export conventions and distinction between basic-price VA and TiVA's tax-inclusive numerator.
SC26-WB-ARCHIVE · World Bank Reproducible Research Repository · 2026-04-01
Institutional delivery of the OECD January 2026 regular table, with a matching March 20, 2026 file-hash record.
Economic & industrial assessment → · Research history → · Editorial responsibility and corrections →